Trends and Statistics
- Quarterly Newsletters
- Alabama STD Report
- Syphilis Statistics
- STD and COVID-19 Comorbidity
- Annual Report
- Archived Statistics
Quarterly Newsletters
- 2019 - Volume One
- 2016 - Volume One
- 2016 - Volume Two
- 2016 - Volume Three
- 2015 - Volume One
- 2015 - Volume Two
- 2015 - Volume Three
Alabama STD Report
- January 2021-March 2025
- January 2021-December 2024
- January 2020-December 2023
- January 2020-June 2023
- January 2020-March 2023
- January 2019-December 2022
- January 2019-September 2022
- January 2019-March 2022
- January 2018-December 2021
- January-September 2021
- January-June 2021
- January-March 2021
- January-December 2020
- January-December 2019
- Alabama STD Snapshot: 2010-2018
- Alabama STD Snapshot: 2010-2019
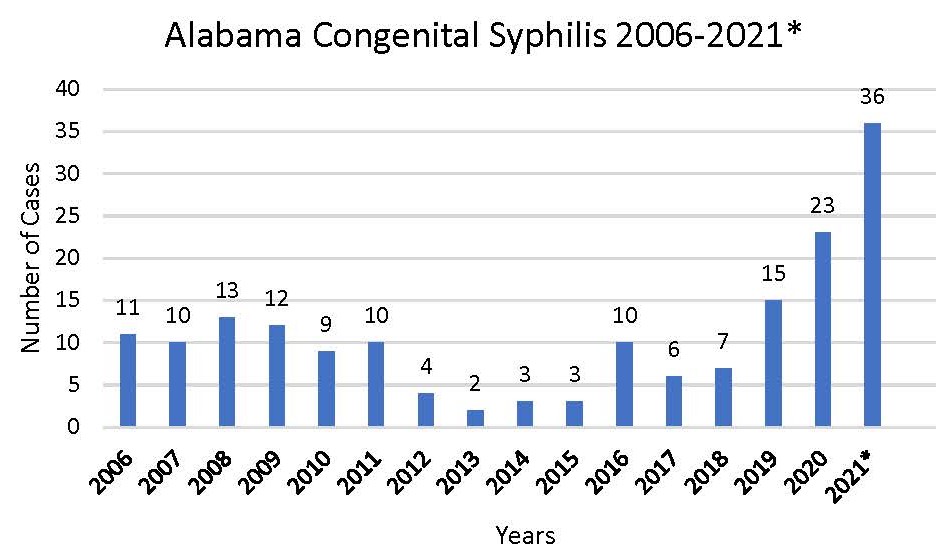
Syphilis Statistics
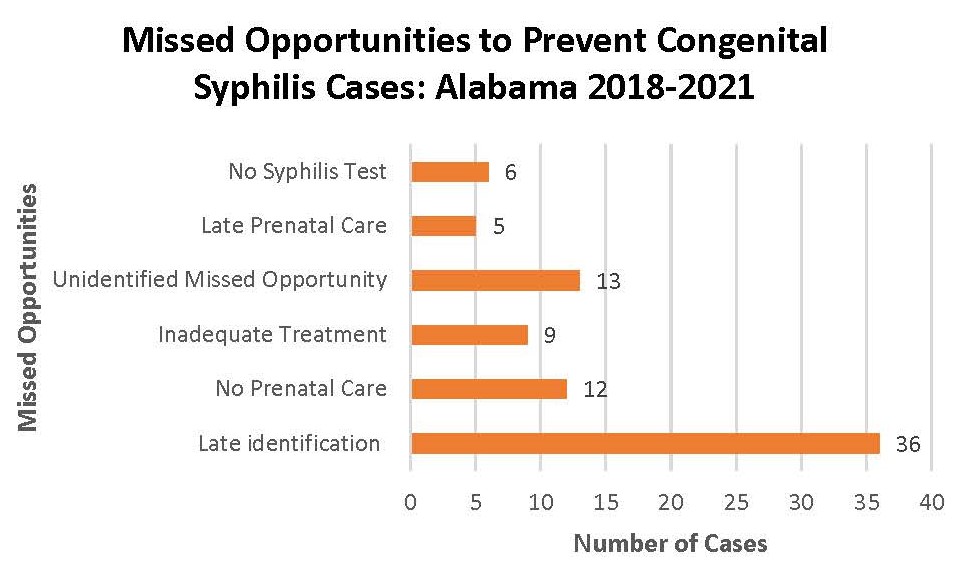
Legend
- Late identification of seroconversion by the provider during pregnancy (Non-reactive initial prenatal visit syphilis test; No additional until labor and delivery)
- No prenatal care (Presents for care during labor)
- Inadequate maternal treatment by the provider (Bicillin injection interval > 7 days)
- Unidentified Missed prevention opportunity (Clinical evidence of congenital syphilis despite adequate maternal adequate treatment 30 days before delivery.)
- Late prenatal care (Prenatal care < two months to deliver)
- No syphilis testing despite receipt of timely prenatal care (No syphilis test ordered by the provider
during prenatal visits until delivery)
STD and COVID-19 Comorbidity
2020 Alabama Sexually Transmitted Diseases Annual Report
The Division of Sexually Transmitted Disease Prevention and Control of the Alabama Department of Public Health is pleased to provide the 2020 Alabama Sexually Transmitted Diseases Annual Report. The report highlights the impact of sexually transmitted diseases among the residents of Alabama.
Archived Statistics
Alabama Sexually Transmitted Diseases: Epidemiology Data Book, 2004-2013
Chart: Chlamydia Infections (1994-2015)
Chart: Gonorrhea Infections (1994-2015)
Chart: Syphilis Infections (1994-2015)
Chlamydia: 2015 | 2014 | 2013 | 2012 | 2011 | 2010 | 2009 | 2008 | 2007 | 2006 | 2005 | 2004 | 2003 | 2002 | 2001 | 2000 | 1999
Gonorrhea: 2015 | 2014 | 2013 | 2012 | 2011 | 2010 | 2009 | 2008 | 2007 | 2006 | 2005 | 2004 | 2003 | 2002 | 2001 | 2000 | 1999
Syphilis: 2015 | 2014 | 2013 | 2012 | 2011 | 2010 | 2009 | 2008 | 2007 | 2006 | 2005 | 2004 | 2003 | 2002 | 2001 | 2000 | 1999
County Totals: 2015 | 2014 | 2013 | 2012 | 2011 | 2010 | 2009 | 2008 | 2007 | 2006 | 2005 | 2004 | 2003 | 2002 | 2001 | 2000 | 1999
Page last updated: April 18, 2025

